Logistic Regression for classify cats
앞선 시간들에 배웠던 Logistic Regression 과 Python/Numpy 지식을 활용하여
사진이 고양이인지 아닌지 판별하는 간단한 Neural network 모델을 만든다.
tesorflow, pytorch같은 좋은 프레임워크들이 있지만, 현재 단계에서는 모델이 어떻게 작동하는지
직관적으로 이해하기 위해 Numpy만을 사용해 구현한다.
Import Library
import numpy as np
import copy
import matplotlib.pyplot as plt
import h5py
import scipy
from PIL import Image
from scipy import ndimage
from lr_utils import load_dataset
from public_tests import *
먼저 모델을 만드는데 쓸 라이브러리들을 import 해준다.
matplotlib은 그래프의 시각화에 있어서 가장 유명한 라이브러리이다.
PIL, scipy는 이미지를 시각화 하는데에 쓰인다.
Load Dataset
train_set_x_orig, train_set_y, test_set_x_orig, test_set_y, classes = load_dataset()

index = 24
plt.imshow(train_set_x_orig[index])
print ("y = " + str(train_set_y[:, index]) + ", it's a '" + classes[np.squeeze(train_set_y[:, index])].decode("utf-8") +  "' picture.")
위의 코드로 데이터셋을 불러오고, 인덱스를 통해 각 사진을 직접 볼 수 있다. (데이터셋에따라 상이함)
m_train = train_set_x_orig.shape[0]
m_test = test_set_x_orig.shape[0]
num_px = test_set_x_orig.shape[1]mtrain, mtest, num_px는 각각 학습,테스트셋의 크기(자료수), 한변의 픽셀 수를 나타낸다.
trainsetx_orig.shape = (209,64,64,3) 크기, 픽셀, 픽셀, 차원
Preproccessing Data
train_set_x_flatten = train_set_x_orig.reshape(train_set_x_orig.shape[0],-1).T
test_set_x_flatten = test_set_x_orig.reshape(test_set_x_orig.shape[0],-1).T
위의 trainsetx_orig은 학습을 하기 위해 reshape를 해주어야 한다.
약간의 trick을 이용하자면, row를 train_x의 갯수로 맞춰주고 두번째 인자에 -1을 주면 주어진 row에 맞게 요소를 재형성한다.
따라서 shape = (209,12288)이고, 여기에 Transpose를 해주어 (12288,209)로 만들어 우리가 앞선 개념시간에 배웠던 것 처럼 한 column이 한 data example에 대한 정보를 나타내게 해준다.
train_set_x = train_set_x_flatten / 255.
test_set_x = test_set_x_flatten / 255.
데이터의 전처리에 있어 standardize는 기본적인 스탭이다. 원래대로라면 각 example에 전체 배열의 평균을 빼주고, 그 값을 standard deviation으로 나누어 주어야 한다.
하지만 Image인 경우에는 그냥 각 요소를 255로 나누어 주는 것으로 편하게 standardize할 수 있다.
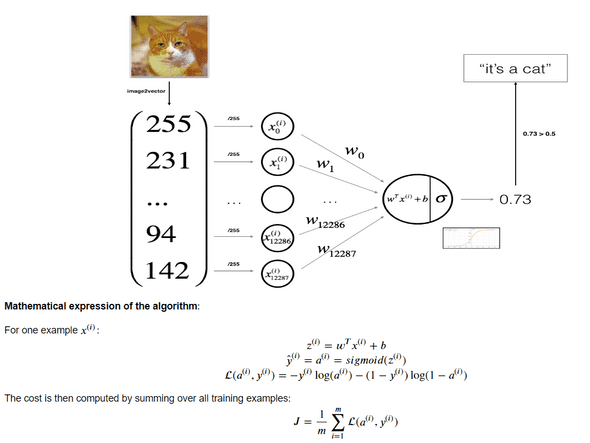
Build Functions
위는 single layer Logistic regression model을 그림으로 표현한 것이다.
이제 기본적인 데이터 전처리가 끝났으니, 다음 스탭에 따라 모델을 설계하면 된다.
- 모델에 쓰일 파라미터 초기화 ( w, b 등)
- Cost를 최소화 하기 위한 파라미터 학습 (트레이닝 세트 사용)
- 학습된 파라미터를 이용해 결과 예측 (테스트 세트 사용)
- 결과 분석
Sigmoid Function
우선 y_hat을 도출하기 위한 sigmoid 함수를 만들어 준다. 이 때, for loop를 사용하는게 아닌 np를 사용해 vector를 받아 한번의 벡터연산으로 값을 return해줄 수 있어야 한다.
def sigmoid(z):

    s = 1/(1+np.exp(z*-1))

    return s
Initialize Function
그 후 w,b의 파라미터를 0으로 초기화 시켜주는 함수를 만든다
def initialize_with_zeros(dim):

    w = np.zeros((dim,1))
    b = 0.0


    return w, b
w를 초기화 할 때, np.zeros(dim)으로 처리하는게 아니라 (dim,1)으로 미리 shape를 정해주어 rank1 numpy array를 사용하여 생길 수 있는 버그를 미리 방지한다.
Propagate Function
다음은 이 파라미터를 학습하는 Foward, Back propagation을 수행하는 함수를 작성한다.
def propagate(w, b, X, Y):


    m = X.shape[1]

    A = sigmoid(w.T.dot(X) +b)## w.shape = 2,1  , x.shape = 2,3 -> A.shape = 1,3
    cost = (-1/m) * np.sum(Y*np.log(A)+(1-Y)*np.log(1-A))  # cost = real number

    dw = (1/m)*(X.dot((A-Y).T)) #X.shape = 2,3  A-Y.shape = 1,3
    db = (1/m)*np.sum(A-Y) # real number

    cost = np.squeeze(np.array(cost))


    grads = {"dw": dw,
             "db": db}

    return grads, cost
A를 만들 때, 앞서 우리가 w를 정의할 때 (m,1)의 dimension으로 만들었기 때문에 X와 dot해줄 수 없다.
따라서 w를 Transpose해준 뒤 곱한다. b는 float형태이지만, python에서 알아서 broadcasting을 해주어 어레이의 모든 수에 더해준다.
cost는 real number이기 때문에 elemetal-wise로 연산을 해서 도출해준다. 그 후 np.squeeze로 real number로 변환.
마지막으로 w,b의 gradient를 cost와 함께 반환해준다.
Optimize Function
def optimize(w, b, X, Y, num_iterations=100, learning_rate=0.009, print_cost=False):


    w = copy.deepcopy(w)
    b = copy.deepcopy(b)

    costs = []

    for i in range(num_iterations):


        grads,cost = propagate(w,b,X,Y)

        dw = grads["dw"]
        db = grads["db"]


        w = w-learning_rate*dw
        b = b - learning_rate*db

        if i % 100 == 0:
            costs.append(cost)

            if print_cost:
                print ("Cost after iteration %i: %f" %(i, cost))

    params = {"w": w,
              "b": b}

    grads = {"dw": dw,
             "db": db}

    return params, grads, costs
위에서 작성한 propagate 함수를 가지고, 반복적으로 w,b를 갱신해 나가는 작업을 하는 optimize함수이다.
𝜃=𝜃−𝛼 𝑑𝜃의 공식으로 w,b를 갱신한다.
Predict Function
def predict(w, b, X):


    m = X.shape[1]
    Y_prediction = np.zeros((1, m))
    w = w.reshape(X.shape[0], 1)

    A = sigmoid(w.T.dot(X) +b)


    for i in range(A.shape[1]): # for m

        if A[0,i] > 0.5:
            Y_prediction[0,i] = 1
        else:
            Y_prediction[0,i] = 0


    return Y_prediction
학습한 parameter들로 예측을 하는 함수이다.
m개에 대한 예측값이므로 Y_prediction은 (1,m)의 shape로 만들어준다.
그 후 결과 값에 따라 1 혹은 0을 저장하여 Y_prediction을 리턴한다.
Model (combine)
def model(X_train, Y_train, X_test, Y_test, num_iterations=2000, learning_rate=0.5, print_cost=False):

    w, b =initialize_with_zeros(X_train.shape[0]) # shape[1]은 데이터 개수, shape[0]이 fetures 개수

    params, grads, costs = optimize(w, b, X_train, Y_train, num_iterations, learning_rate, print_cost)

    w = params["w"]
    b = params["b"]

    #grads는 왜return함?

    Y_prediction_test = predict(w,b,X_test)
    Y_prediction_train = predict(w,b,X_train)

    if print_cost:
        print("train accuracy: {} %".format(100 - np.mean(np.abs(Y_prediction_train - Y_train)) * 100))
        print("test accuracy: {} %".format(100 - np.mean(np.abs(Y_prediction_test - Y_test)) * 100))


    d = {"costs": costs,
         "Y_prediction_test": Y_prediction_test,
         "Y_prediction_train" : Y_prediction_train,
         "w" : w,
         "b" : b,
         "learning_rate" : learning_rate,
         "num_iterations": num_iterations}

    return d
Model은 우리가 앞서 정의했던 함수들을 사용하여 파라미터를 초기화, propagate, optimize, predict까지 순차적으로 실행시켜주는 함수라고 생각할 수 있다.
최정적으로는 결과값과 예측 정확도를 print해준다.
Evaluate Model
index = 3
plt.imshow(test_set_x[:, index].reshape((num_px, num_px, 3)))
print ("y = " + str(test_set_y[0,index]) + ", you predicted that it is a \"" + classes[int(logistic_regression_model['Y_prediction_test'][0,index])].decode("utf-8") +  "\" picture.")
이 코드를 통해 해당 인덱스의 사진, 정답, 그리고 모델의 예측값을 확인할 수 있다.
연관글
Neural Networks and Deep Learning

